seajay wrote: ↑Sat Oct 23, 2021 1:15 pm
murphy_p_t wrote: ↑Sat Oct 23, 2021 12:53 pm
seajay wrote: ↑Sat Oct 23, 2021 8:06 am
For the method I outlined earlier and from 1900 ...

4% was more a PWR, and in one case you ended with over seven times the inflation adjusted start date portfolio value after 4% SWR withdrawals (a additional 6,7% annualized real on top).
BUT that did direct towards around a 75/25 stock/Precious Metal broad average (since 1933).
Fundamentally stocks are leveraged, of the order $30T cap versus $9T for corporate bond cap. Leverage broadly just scales volatility, not rewards, so its reasonable to deleverage i.e. allocate $30 to stocks, $9 to corporate bonds, which with rounding is close to 75/25 stock/bond proportions. Corporate bonds pay higher premiums reflective of their default rate,
so 10 year Treasury might be substituted in instead. Or even
gold (or silver).
Mix in some averaging such as two timepoint entry to avoid loading fully in at the worst possible start date, and some relative valuation ... and overall rewards at least historically were satisfactory (good chance of your money outliving you).
Silver was used in the above on the grounds of the US outlawing investment gold between 1940's and 1970's. Outside of that and where investment gold was permitted it worked to similar effect.
To reiterate that is based on the assumption that pre 1933 when on the gold standard investors might have preferred to hold just bonds (T-Bills/whatever), but where during WW1 years the investor might have rotated into silver. From 1933 the relative Dow/Gold ratio directed the amount of PM to start each year with (relative valuation).
Seajay... Very interesting concept. I was recently thinking of deviating from the pp in a direction like this.
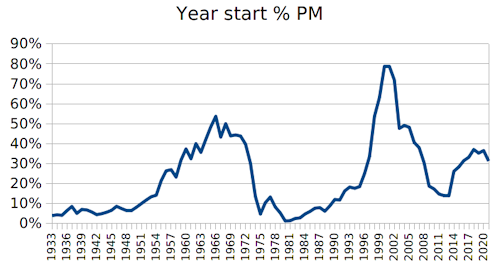
Can you include a chart showing percent PM versus year?
Also, what are the units in your first chart?
Units in the first chart are multiples of original inflation adjusted start date amount remaining after 30 years, so 1 = 100% of the inflation adjusted original amount, 2 = twice as much ...etc.
Year start % PM ...
Dow/Gold ratio data (year start values)
Code: Select all
1933	2.9
1934	3.1
1935	3.0
1936	4.1
1937	5.1
1938	3.5
1939	4.4
1940	4.3
1941	3.8
1942	3.1
1943	3.4
1944	3.7
1945	4.2
1946	5.2
1947	4.6
1948	4.2
1949	4.2
1950	4.9
1951	5.8
1952	6.7
1953	7.5
1954	7.9
1955	11.5
1956	13.9
1957	14.2
1958	12.4
1959	16.6
1960	19.3
1961	16.9
1962	20.6
1963	18.4
1964	21.6
1965	24.7
1966	27.3
1967	22.2
1968	25.5
1969	22.5
1970	22.7
1971	22.4
1972	20.5
1973	15.8
1974	7.6
1975	3.3
1976	6.1
1977	7.5
1978	5.0
1979	3.6
1980	1.6
1981	1.6
1982	2.2
1983	2.3
1984	3.3
1985	3.9
1986	4.7
1987	4.9
1988	4.0
1989	5.3
1990	6.9
1991	6.7
1992	9.0
1993	9.9
1994	9.6
1995	10.0
1996	13.2
1997	17.4
1998	27.3
1999	31.9
2000	39.5
2001	39.6
2002	36.2
2003	24.3
2004	25.1
2005	24.6
2006	20.9
2007	19.6
2008	15.9
2009	10.1
2010	9.4
2011	8.2
2012	7.8
2013	7.9
2014	13.8
2015	14.9
2016	16.4
2017	17.2
2018	19.1
2019	18.3
2020	18.9
2021	16.3

Year start Dow/Gold ratio

Stochastic of 1 lower, 50 upper
( current - lower ) / ( upper - lower )
So yearly value - 1 divided by 49
i.e. year start 2021 Dow/Gold ratio 16.3 so 15.3 / 49 = 0.31 (31% PM, so 69% stock).
Given a indicator of %PM, then on the stock side let Buffett take care of appropriate %cash reserves ...
Code: Select all
		Inflation	BRK		Gold		Dow/Gold %PM	Portfolio
1986	1.10%	14.17%	18.96%	4.7		7.6%	14.5%
1987	4.43%	4.61%	24.53%	4.9		8.0%	6.2%
1988	4.42%	59.32%	-15.26%	4		6.1%	54.8%
1989	4.65%	84.57%	-2.84%	5.3		8.8%	76.9%
1990	6.11%	-23.05%	-3.11%	6.9		12.0%	-20.6%
1991	3.06%	35.58%	-8.56%	6.7		11.6%	30.4%
1992	2.90%	29.83%	-5.73%	9		16.3%	24.0%
1993	2.75%	38.94%	17.68%	9.9		18.2%	35.1%
1994	2.67%	24.96%	-2.17%	9.6		17.6%	20.2%
1995	2.54%	57.35%	0.98%	10.1		8.4%	47.0%
1996	3.32%	6.23%	-4.59%	13.2		24.9%	3.5%
1997	1.70%	34.90%	-21.41%	17.4		33.5%	16.1%
1998	1.61%	52.17%	-0.83%	27.3		53.7%	23.7%
1999	2.68%	-19.86%	0.85%	31.9		63.1%	-6.8%
2000	3.39%	26.56%	-5.44%	39.5		78.6%	1.4%
2001	1.55%	6.48%	0.75%	39.6		78.8%	2.0%
2002	2.38%	-3.77%	25.57%	36.2		71.8%	17.3%
2003	1.88%	15.81%	19.89%	24.3		47.6%	17.8%
2004	3.26%	4.33%	4.65%	25.1		49.2%	4.5%
2005	3.42%	0.82%	17.77%	24.6		48.2%	9.0%
2006	2.54%	24.11%	23.20%	20.9		40.6%	23.7%
2007	4.08%	28.74%	31.92%	19.6		38.0%	29.9%
2008	0.09%	-31.78%	4.32%	15.9		30.4%	-20.8%
2009	2.72%	2.69%	25.04%	10.1		18.6%	6.8%
2010	1.50%	21.42%	29.24%	9.4		17.1%	22.8%
2011	2.96%	-4.73%	8.93%	8.2		14.7%	-2.7%
2012	1.74%	16.82%	8.26%	7.8		13.9%	15.6%
2013	1.50%	32.70%	-27.33%	7.9		14.1%	24.2%
2014	0.76%	27.04%	0.12%	13.8		26.1%	20.0%
2015	0.73%	-12.48%	-12.11%	14.9		28.4%	-12.4%
2016	2.07%	23.42%	8.10%	16.4		31.4%	18.6%
2017	2.11%	21.91%	12.66%	17.2		33.1%	18.9%
2018	1.91%	2.82%	-0.93%	19.1		36.9%	1.4%
2019	2.29%	10.98%	18.43%	18.3		35.3%	13.6%
2020	1.36%	2.42%	24.61%	18.9		36.5%	10.5%
								16.3		31.2%
A couple of quick questions:
1. In your 1900-present return chart did you use silver for 1914-1918 (or perhaps 1914-1919) or did you use T-Bills? If you used silver during the inflationary WWI years but then
DIDN'T use it during the deflationary mid-year 1920 through late 1920s period then this is kind of "loading the dice" a bit and overstating portfolio returns for the whole period 1914-1929.
2. Did you use silver for 1933 or gold?
3. Did you stop using silver in 1971, 1972, 1973, 1974, or at the beginning of 1975? In other words, what year did you start using gold in the portfolio in lieu of silver? Or did you just always use silver from 1933 onward until today and never use gold?
4. While I personally have Berkshire annual returns back to 1964 and Buffett Partnership (LP) returns back to 1957 for before that if needed for backtesting something like this I do have to ask....don't you think it is a bit of a survivorship bias stretch to use only Berkshire as the "stock" portion of the holdings? One, not everyone knew about Warren Buffett and Berkshire Hathaway; he wasn't nearly as famous as he is now until (arguably) the mid-1980s; two, Buffet's returns from, say, 1957 to 1995 or so are unlikely to be repeated for several reasons (first, in the very early years of Buffet's investing career--say the late 50s to the mid-1970s--stocks were a lot cheaper and lower PE than they are now; second, from the mid-60s to the mid-90s Berkshire itself was a good bit smaller than today and thus could deploy its capital more nimbly into potentially higher returning smaller and midcap issues rather than only being able to focus on large caps like today's Berkshire is forced to do when it wants to acquire a company; and third, eventually Buffett--and for that matter Munger--will be dead and thus Berkshire won't have their investment expertise any more); three, using only Berkshire doesn't include the many insurance or reinsurance or holding companies that weren't nearly as successful as Berkshire Hathaway was (i.e. classic survivorship bias). FWIW I do think Berkshire will continue to beat the market over the long-run; using interest-free insurance premium float to buy good, stable, richly cash-flowing companies is an excellent business strategy.....I just don't think it will beat it by anywhere near the 8 or 9% annually on average that Buffett has beaten the market by since he started investing (indeed, as per Warren Buffett's own admission his returns over the last 20-25 years or so are nowhere near what he was able to achieve in Berkshire's earlier days).