
The traditional 60/40 portfolio has gone from bad to worse. Down -21.3% YTD. Worst performance since 1931. Ugh.
https://twitter.com/charliebilello/stat ... 78/photo/1
PP YTD performance - was it the worst ever?
Moderator: Global Moderator
Re: PP YTD performance - was it the worst ever?
- Attachments
-
- 60-40-2022YTD3.png (50.27 KiB) Viewed 64173 times
-
mathjak107

- Executive Member

- Posts: 4782
- Joined: Fri Jun 19, 2015 2:54 am
- Location: bayside queens ny
- Contact:
Re: PP YTD performance - was it the worst ever?
Portfolio visualizer shows 60% spy 40% bnd down 20% in 2008

Re: PP YTD performance - was it the worst ever?
That makes sense since BND includes a lot of non-Treasuries like corporate bonds and mortgage backed securities. The chart used only 10 year Treasuries as bonds.mathjak107 wrote: ↑Wed Oct 12, 2022 9:36 am Portfolio visualizer shows 60% spy 40% bnd down 20% in 2008
-
mathjak107
- Executive Member
- Posts: 4782
- Joined: Fri Jun 19, 2015 2:54 am
- Location: bayside queens ny
- Contact:
Re: PP YTD performance - was it the worst ever?
I think more representative is a total bond fund as far as what most use or even how a balanced fund would look
Re: PP YTD performance - was it the worst ever?
I agree. I think BND is more in line with what most people doing a 60/40 have.mathjak107 wrote: ↑Wed Oct 12, 2022 10:24 am I think more representative is a total bond fund as far as what most use or even how a balanced fund would look

Re: PP YTD performance - was it the worst ever?
In 2008 I think a lot of 401K's had PIMCO Total Return as the bond fund.mathjak107 wrote: ↑Wed Oct 12, 2022 10:24 am I think more representative is a total bond fund as far as what most use or even how a balanced fund would look
Not sure if it makes much of a difference overall
SPY (60%) and PIMCO Total Return (40%) comes out to -20.15% for 2008
-
mathjak107
- Executive Member
- Posts: 4782
- Joined: Fri Jun 19, 2015 2:54 am
- Location: bayside queens ny
- Contact:
Re: PP YTD performance - was it the worst ever?
We had fidelity total bond in ours ..it really got hit ..
Fidelity had their core funds which were funds fore the fund managers to use .
The cores hadA lot of paper that turned toxic so even their most conservative bond funds got creamed
Fidelity had their core funds which were funds fore the fund managers to use .
The cores hadA lot of paper that turned toxic so even their most conservative bond funds got creamed
Re: PP YTD performance - was it the worst ever?
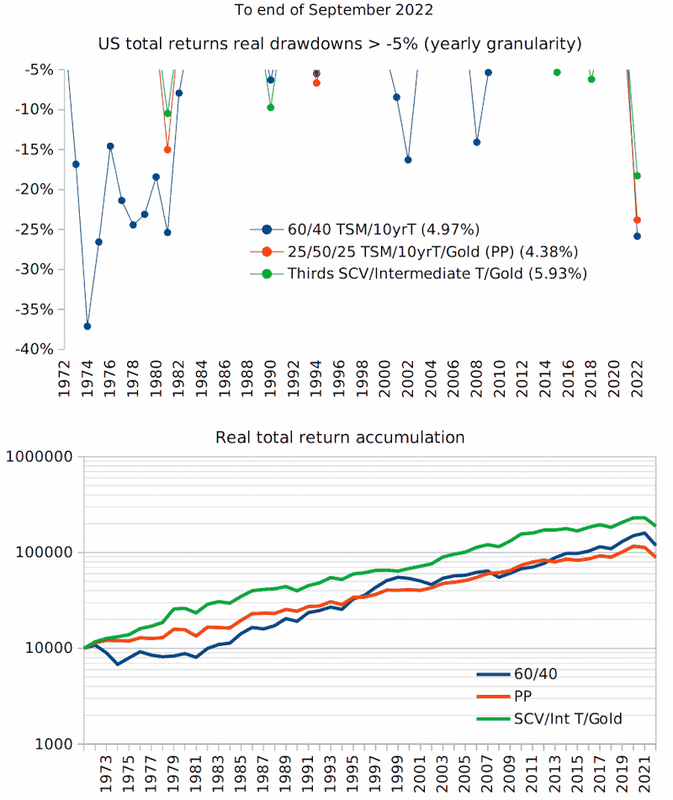
Maybe it would also be worth looking at a cashless PP - thirds of LTTs, stocks, and gold. That performs a lot better than the regular PP, historically (but not lately, obviously).
Re: PP YTD performance - was it the worst ever?
By decade, 1980 and Dow/Gold was very low (stocks cheap/gold expensive) .. chuck out gold (thirds each stock/LTT/cash). Similar for 1990. 2000 and Dow/Gold was very high, stocks expensive/gold cheap, as were PE's etc indicating stocks were expensive (so thirds each LTT/cash/Gold). 2010 and Dow/Gold was again back down to lowish levels (thirds stock/cash/LTT). 2020 ... and LTT's low yields (thirds stock/cash/gold).
If you held a PP minus the 'expensive' asset for a decade as measured at the start of each decade
1980's/90's
2000's
2010's
2020's to recent
In total $10,000 grew to $454,403, compared to $182,019 for the PP (3.69% annualized real). Near-as 2.5 times more over a little under 43 years (so 2.15% annualized more, which would make a 3.69 + 2.15 = 5.84% annualized real).
If you didn't rebalance yearly, just the above rotations once/decade, left as is for the decade, then the final value was $547,402, 3x more than the PP (6.3% annualized real). 100% TSM yielded 7.49% annualized real from the start of 1980, but with much deeper down bad-years. 60/40 yearly rebalanced 5.39% annualized real (5.77% if not rebalanced). If again you didn't rebalance other than at the start of each decade and held Small Cap Value stock instead of TSM, then that ended with a $639,472 final value, 3.51 times more than the PP (6.66% annualized real).
If you scroll down to the Annual returns bars in each of the above links that also provides a indicator of bad years of which, until the current year, there were few and very small bad year declines. Current year to end of September -11% (thirds each stock/cash/gold).
If when drawing a income you withdraw in proportion of the current weightings at the time, then the same % rewards are achieved, just a lower final value amount due to the withdrawals.
Your cashless PP suggestion comes in better reward than the PP, but deeper bad years, and less rewarding ($253,826 final value) than the rotational approach.


Re: PP YTD performance - was it the worst ever?
A lot of lockstep this morning. :-(
Re: PP YTD performance - was it the worst ever?
Yep...I don't have my data in front of me but correlations have been on the rise for a while now.
-
Mark Leavy

- Executive Member
- Posts: 1950
- Joined: Thu Mar 01, 2012 10:20 pm
- Location: US Citizen, Permanent Traveler
Re: PP YTD performance - was it the worst ever?
The fascinating thing about uncorrelated assets is that if they don't move in lockstep from time to time - then they are by definition correlated.
True randomness has to appear to show patterns or it is not random.
Just a fun musing. Nothing that applies directly to the nature of the Permanent Portfolio's primary asset classes.
True randomness has to appear to show patterns or it is not random.
Just a fun musing. Nothing that applies directly to the nature of the Permanent Portfolio's primary asset classes.

Re: PP YTD performance - was it the worst ever?
YTD performance for the Canadian PP is -4.61%. Holding steady.
I like it.
I like it.
www.ironwealth.org
Re: PP YTD performance - was it the worst ever?
Since 2013 (Yellen), and there's been a return to a semi-pegging, a multi-facet gold/dollar standard and as such gold has been flatish/range-bound. Not doing what otherwise might have been expected. As such the PP would seem to be performing more as-expected in other countries, whilst not so in the US.

Re: PP YTD performance - was it the worst ever?
The strong dollar hasn't helped the gold portion of the HBPP over the last few years, that's for sure. Do you think the "semi-pegging" starting in 2013 was a policy decision by the Fed?seajay wrote: ↑Thu Dec 08, 2022 6:48 pm Since 2013 (Yellen), and there's been a return to a semi-pegging, a multi-facet gold/dollar standard and as such gold has been flatish/range-bound. Not doing what otherwise might have been expected. As such the PP would seem to be performing more as-expected in other countries, whilst not so in the US.
Re: PP YTD performance - was it the worst ever?
https://www.congress.gov/bill/113th-con ... -bill/1576stpeter wrote: ↑Sat Dec 10, 2022 7:55 pmThe strong dollar hasn't helped the gold portion of the HBPP over the last few years, that's for sure. Do you think the "semi-pegging" starting in 2013 was a policy decision by the Fed?seajay wrote: ↑Thu Dec 08, 2022 6:48 pm Since 2013 (Yellen), and there's been a return to a semi-pegging, a multi-facet gold/dollar standard and as such gold has been flatish/range-bound. Not doing what otherwise might have been expected. As such the PP would seem to be performing more as-expected in other countries, whilst not so in the US.
https://www.bullionvault.com/gold-news/ ... -041120181Dollar Bill Act of 2013 - Directs the Board of Governors of the Federal Reserve System (Board) to: (1) designate a "Target Week"; (2) employ a random process to select a specific day, hour, minute, and second during such Target Week as "Target Moment" (which shall not be publicly disclosed); (3) make the value of the U.S. dollar at the Target Moment equal to the price of gold on the exchange operated by the Commodities Exchange, Inc. (COMEX) of the New York Mercantile Exchange, Inc.; and (4) maintain the value of the U.S. dollar within plus or minus 2% of such price ("Target Range") thereafter.
Greenspan from 2017:
"When I was Chair of the Federal Reserve I used to testify before US Congressman Ron Paul, who was a very strong advocate of gold. We had some interesting discussions. I told him that US monetary policy tried to follow signals that a gold standard would have created. That is sound monetary policy even with a fiat currency.
If a policy, what does that mean for the PP? Well when on the gold standard, money/gold convertible at a fixed rate, it makes more sense to hold money, deposited into treasuries to earn interest - as that's like the state paying you for it to securely store your gold.On February 27, 2015, Yellen met with a group of twenty-one members of "the center right", which included American Principles in Action chairman Sean Fieler; APA monetary policy director Steve Lonegan, Ralph Benko, Prof. Brian Domitrovic, Judy Shelton, and then-Cato Institute president John Allison – all of them among the best of a rather small group of gold standard advocates (or, at the least, people friendly to the idea).
To summarize: when monetary policy more closely resembles a gold standard system (that is, the value of the Dollar is more stable vs. gold), good things happen; and when it does not, bad things happen.
-
johnnywitt
- Senior Member
- Posts: 147
- Joined: Fri May 08, 2020 6:06 pm
Re: PP YTD performance - was it the worst ever?
How would your Wife feel if we entered a 1929-1953 or a 1966-1982 event, or maybe a Japanese style meltdown. I wonder how she would feel about that.jason wrote: ↑Tue Sep 06, 2022 2:12 pm I was just wondering if the performance of the PP year-to-date is the worst it has ever performed, or has it had a period(s) in the past where it actually performed worse? I've been doing the PP for 9 years and my returns are anemic. My CAGR is around 5%. Because I am retired and living off of my investments, I'm looking at the possibility of having to move into riskier investments or else having to slash my lifestyle/living expenses, which my wife probably will not want to tolerate. She'd rather take more risk than do that. Are many people here still optimistic about it bouncing back?

Re: PP YTD performance - was it the worst ever?
I think I posted in Fall 2022 on one of these threads that it would be a great time to enter the PP, on a severe drawdown (worst of all time, it turns out). Looks like I was right.
Since then, HBPP beats 60/40, which it usually doesn't do in a bull market. We're still in a bull market in stocks since March 2009, though it may be ending soon...
Don't speculate, don't time the market... just listen to the Orange Cat
I saw another post from late 2022, title was something like "Help a newbie to trust the PP". No... that was the time to go all-in.
Human psychology (herding instinct) never changes. It's hard-wired into us. Buy high, sell low.
-
mathjak107
- Executive Member
- Posts: 4782
- Joined: Fri Jun 19, 2015 2:54 am
- Location: bayside queens ny
- Contact:
Re: PP YTD performance - was it the worst ever?
buy low, sell high has lost more money for investors .ochotona wrote: ↑Fri May 23, 2025 7:57 am I think I posted in Fall 2022 on one of these threads that it would be a great time to enter the PP, on a severe drawdown (worst of all time, it turns out). Looks like I was right.
Since then, HBPP beats 60/40, which it usually doesn't do in a bull market. We're still in a bull market in stocks since March 2009, though it may be ending soon...
Don't speculate, don't time the market... just listen to the Orange Cat
I saw another post from late 2022, title was something like "Help a newbie to trust the PP". No... that was the time to go all-in.
Human psychology (herding instinct) never changes. It's hard-wired into us. Buy high, sell low.
no one knows where low is and next stop is usually lower and lower .
investors either get stopped out or panic more often than not .
the trend is your friend and buying high and selling higher is usually up as the next move.
while buy low sell high sounds good , it’s actually buying high and selling higher that makes the most money over all for most investors
Re: PP YTD performance - was it the worst ever?
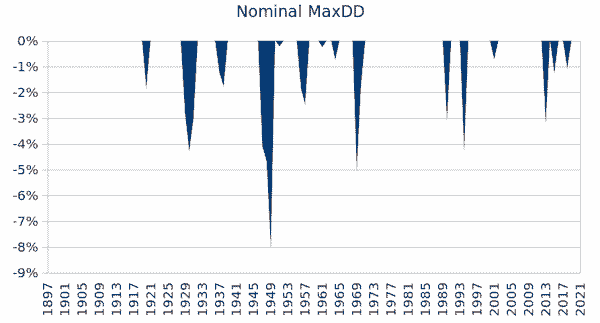
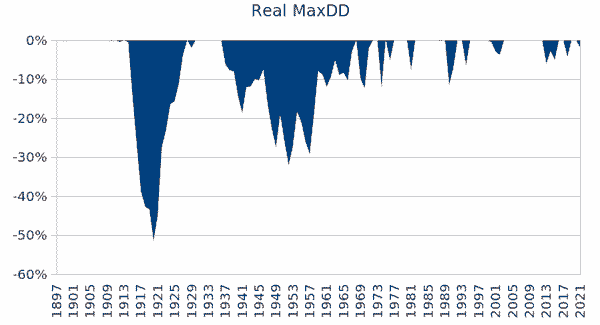
@seajay, where are these charts coming from? You have the data? Would you be willing to share?seajay wrote: ↑Fri Sep 09, 2022 4:23 am Nominal drawdowns are misleading. Adjusting for inflation and relative to the end of 2020 the PP as of end of August 2022 was down deeper than -20% real (after inflation). And of course deeper if you're also drawing a income.
British PP, yearly granularity of drawdowns
Some deep and extended-downs in real terms historically, but where it preserved your money i.e. 3.33% 30 year SWR 'return of money' success rate, and more often leaving a reasonable inflation adjusted residual amount after having 'returned your (inflation adjusted) money'
Re: PP YTD performance - was it the worst ever?
For US year end values multiple the British Pound price by the $£ value
Year Gold Price £ Silver £ Copper £ $£
1931 4.25 0.064 0.014 4.54
1932 6.75 0.080 0.016 3.51
1933 7.14 0.083 0.017 4.24
1934 7.87 0.095 0.015 5.04
1935 8.13 0.131 0.017 4.90
1936 8.02 0.091 0.021 4.97
1937 8.05 0.091 0.021 4.94
1938 8.16 0.088 0.019 4.89
1939 8.83 0.088 0.023 4.43
1940 9.61 0.091 0.027 3.83
1941 9.61 0.087 0.026 4.03
1942 9.61 0.094 0.026 4.04
1943 9.61 0.112 0.026 4.04
1944 9.61 0.112 0.026 4.04
1945 9.61 0.129 0.029 4.03
1946 9.61 0.198 0.039 4.03
1947 9.61 0.179 0.048 4.03
1948 9.61 0.184 0.046 4.03
1949 9.61 0.195 0.049 3.69
1950 14.18 0.264 0.073 2.80
1951 14.18 0.318 0.077 2.80
1952 14.23 0.304 0.085 2.79
1953 14.13 0.302 0.093 2.81
1954 14.23 0.303 0.106 2.81
1955 14.36 0.319 0.126 2.79
1956 14.30 0.329 0.114 2.80
1957 14.33 0.329 0.089 2.79
1958 14.29 0.317 0.090 2.81
1959 14.29 0.328 0.100 2.81
1960 14.36 0.328 0.099 2.81
1961 14.36 0.332 0.108 2.80
1962 14.29 0.388 0.103 2.81
1963 14.34 0.461 0.109 2.80
1964 14.39 0.469 0.133 2.79
1965 14.35 0.465 0.206 2.80
1966 14.42 0.469 0.193 2.79
1967 14.64 0.818 0.209 2.75
1968 17.59 0.817 0.213 2.38
1969 14.67 0.746 0.304 2.40
1970 15.62 0.682 0.194 2.39
1971 17.08 0.537 0.190 2.55
1972 27.58 0.866 0.213 2.35
1973 48.35 1.402 0.374 2.32
1974 79.74 1.904 0.227 2.35
1975 69.29 2.065 0.273 2.02
1976 79.02 2.557 0.370 1.70
1977 86.84 2.497 0.315 1.91
1978 110.27 2.960 0.348 2.04
1979 235.19 14.469 0.471 2.23
1980 247.12 6.503 0.360 2.39
1981 208.75 4.269 0.393 1.92
1982 277.49 6.731 0.430 1.61
1983 262.98 6.143 0.460 1.45
1984 265.69 5.426 0.490 1.16
1985 226.94 4.011 0.444 1.44
1986 264.57 3.578 0.413 1.48
1987 259.88 3.579 0.700 1.87
1988 227.55 3.341 0.770 1.80
1989 249.84 3.240 0.664 1.61
1990 203.01 2.173 0.608 1.93
1991 188.58 2.062 0.520 1.87
1992 220.17 2.426 0.684 1.51
1993 263.69 3.453 0.562 1.48
1994 244.57 3.102 0.888 1.56
1995 250.13 3.313 0.787 1.55
1996 217.38 2.822 0.593 1.70
1997 174.72 3.624 0.470 1.66
1998 173.42 3.010 0.404 1.66
1999 179.61 3.298 0.533 1.62
2000 182.83 3.066 0.566 1.49
2001 190.76 3.117 0.454 1.45
2002 212.82 2.894 0.436 1.61
2003 234.15 3.340 0.586 1.78
2004 226.94 3.528 0.756 1.93
2005 297.43 5.126 1.198 1.72
2006 324.04 6.572 1.462 1.96
2007 417.62 7.369 1.517 2.00
2008 596.14 7.408 0.970 1.45
2009 684.18 10.494 2.072 1.61
2010 908.73 19.730 2.865 1.55
2011 1020.35 18.240 2.226 1.54
2012 1029.32 18.524 2.258 1.62
2013 726.99 11.797 2.061 1.65
2014 769.84 10.232 1.815 1.56
2015 716.36 9.328 1.439 1.48
2016 942.58 13.200 2.036 1.23
2017 960.84 12.480 2.443 1.35
2018 1005.45 12.110 2.064 1.27
2019 1157.78 13.660 2.126 1.32
2020 1382.58 19.410 2.572 1.37
2021 1347.06 17.140 3.302 1.35
2022 1505.16 19.890 3.172 1.20
2023 1622.49 18.67 3.061 1.27
2024 2083.2 23.05 3.211 1.25
For US stock and T-Bills/Bonds/CPI data I suggest using Simba's backtest spreadsheet https://www.bogleheads.org/wiki/Simba%2 ... preadsheet
Re: PP YTD performance - was it the worst ever?
Note that for PM I tend to assume that pre 1914 when gold was money (Sovereign Pound coins) that those with surplus money might have deposited that gold for safe keeping - and some interest. From 1915 (WW1) to 1974 I assume they might have held silver instead of gold i.e. part in reflection that the average person might have held silver instead of gold and part in reflection that in America gold was compulsory purchased in 1933 so someone with a PM preference might have bought silver with the gold sale proceeds. From the start of 1975 when investment gold again became legal in the US then they might have swapped a large stack  (weight) of silver, for a smaller stack (weight) of gold.
For gold pre 1933 and it was pretty much fixed at GBP 4.24/ounce at least back to the 1720's https://www.measuringworth.com/datasets/gold/ i.e. a Sovereign Pound coin contains just under a quarter ounce (0.2354 oz) of gold and 1/0.2354 = 4.248, but again where those with surplus Sovereigns might have deposited them for safety/interest.
The Sovereign has some weird history, such as some historical fakes that contain more gold value than the official coin, replicated for other reasons than the gold content value. Pleasing in one respect for a individual selling such a coin to a dealer when they're told that to be the case (most turn white when they first hear they were selling a fake in expectation of it being near valueless) and that they'll still get the gold melt value, but uncomfortable when they realise that they could have landed in deep waters in having passed on a fake in a country where that is considered illegal, and that in not being legal tender any gains are capital gains tax liable (whereas legal tender Sovereigns are exempt from capital gains tax).
Re: PP YTD performance - was it the worst ever?
PM since the early 1930's (Britain broke away from the gold-peg in 1931, the US followed that in 1933) and 50/50 dollar bills (hard currency) and PM (silver 1930's to mid 1970's, gold thereafter) broadly negated US CPI, and if converted to Pounds also broadly negated British Retail Price Index inflation. But in a volatile manner i.e. for some point to point periods out-ran inflation, in other point to point periods lagged inflation.
Much of investing is about averaging, average in (save) over many years, average out (spend) over many years, average down the average cost of assets such as via periodic rebalancing. Which is inclined to see you achieve the broader average rewards/outcome - that tends to be a good/reasonable outcome. With lumping in, and out, at single time points your outcome is inclined to be much more variable.
Rather that keeping piles of $20 bills and gold coins stuffed under your mattress, investing the $20's into stocks, 50/50 stock/gold and once/year rebalancing ... is inclined to lead to a good outcome over time, especially when accumulated (averaged into) over many years, and spent down over many years. I personally prefer just that rather than including Treasury's, as I'm not keen at all about lending to someone who has a money printing press and as such has no real need to borrow. That's more volatile than when 50% are in T-Bills/LTT barbell or 10 year Treasury bullet, but you're in effect rewarded for taking on volatility and provided you average in/out/down then that all washes out. I feel we have enough bond (indirect) exposure via pensions, so owning a home + stocks + gold + pensions is enough diversification without adding bonds on top of that.
Re: PP YTD performance - was it the worst ever?
Thank you!!