A Gold Price Model

Discussion of the Gold portion of the Permanent Portfolio

Moderator: Global Moderator

Post Reply
kev_in_tw
Associate Member
Associate Member
Posts: 33
Joined: Thu Jul 19, 2012 8:01 am
Location: Taipei, Taiwan

A Gold Price Model

Post by kev_in_tw »

http://www.crossingwallstreet.com/archi ... -gold.html
Before I get to my model, I want to take a step back for a moment and discuss a strange paradox in economics known as Gibson’s Paradox. This is one the most puzzling topics in economics. Gibson’s Paradox is the observation that interest rates tend to follow the general price level and not the rate of inflation. That’s very strange because it seems obvious that as inflation rises, interest rates ought to keep up. And as inflation falls back, rates should move back as well. But historically, that wasn’t the case.

Instead, interest rates rose as prices rose, and rates only fell when there was deflation. This paradox has totally baffled economists for years. Yet it really does exist. John Maynard Keynes called it “one of the most completely established empirical facts in the whole field of quantitative economics.”? Milton Friedman and Anna Schwartz said that “the Gibsonian Paradox remains an empirical phenomenon without a theoretical explanation.”?

Even many of today’s prominent economists have tried to tackle Gibson’s Paradox. In 1977, Robert Shiller and Jeremy Siegel wrote a paper on the topic. In 1988 Robert Barsky and none other than Larry Summers took on the paradox in their paper “Gibson’s Paradox and the Gold Standard,”? and it’s this paper that I want to focus on. (By the way, in this paper the authors thank future econobloggers Greg Mankiw and Brad DeLong.)

It’s my hypothesis that Summers and Barsky are on to something and that we can use their insight to build a model for the price of gold. The key is that gold is tied to real interest rates. Where I differ from them is that I use real short-term interest rates whereas they focused on long-term rates.

Here’s how it works. I’ve done some back-testing and found that the magic number is 2% (I’m dumbing this down for ease of explanation). Whenever the dollar’s real short-term interest rate is below 2%, gold rallies. Whenever the real short-term rate is above 2%, the price of gold falls. Gold holds steady at the equilibrium rate of 2%. It’s my contention that this was what the Gibson Paradox was all about since the price of gold was tied to the general price level.

Now here’s the kicker: there’s a lot of volatility in this relationship. According to my backtest, for every one percentage point real rates differ from 2%, gold moves by eight times that amount per year. So if the real rates are at 1%, gold will move up at an 8% annualized rate. If real rates are at 0%, then gold will move up at a 16% rate (that’s been about the story for the past decade). Conversely, if the real rate jumps to 3%, then gold will drop at an 8% rate.
He has a back test, which looks plausible

Image
Pres
Full Member
Full Member
Posts: 74
Joined: Sun Apr 25, 2010 10:07 pm
Location: Eurozone

Re: A Gold Price Model

Post by Pres »

MangoMan wrote: Can someone tell me where to monitor [or calculate] real interest rates?
Some time ago I quickly put something together to pull that data into Excel from a couple of web pages.
Unsure if it's entirely correct: I grabbed the 3 month UST yield from here: http://finance.yahoo.com/bonds
and substract the US inflation rate from here:
http://www.rateinflation.com/inflation- ... n-rate.php

Don't shoot me if there's an error somewhere.
Last edited by Pres on Thu Jul 19, 2012 2:36 pm, edited 1 time in total.
User avatar
Gosso
Executive Member
Executive Member
Posts: 1052
Joined: Fri Jan 06, 2012 8:22 am
Location: Canada

Re: A Gold Price Model

Post by Gosso »

You can check the yield on five year TIPS.  http://research.stlouisfed.org/fred2/series/DFII5

Or use the same FRED site to find the 10 year yield on nominal bonds, and then subtract the annualized CPI-U (also found on FRED).

Although they don't produce the same result, since 5 year TIPS have been steadily becoming more negative, while over the past 10 months the 10 year nominal minus CPI has been moving up towards 0% (which has coincided very nicely with the past 10 months of stagnant gold).
User avatar
Gosso
Executive Member
Executive Member
Posts: 1052
Joined: Fri Jan 06, 2012 8:22 am
Location: Canada

Re: A Gold Price Model

Post by Gosso »

I also like the gold/dow ratio, which has worked reasonably well to tell us when a gold bull/bear market is approaching its end.  So I think we can use both the real interest rates and gold/dow ratio to determine a switch from gold to stocks.

Image
http://www.sharelynx.com/chartstemp/DowGoldRatio.php

I may place 5% of my portfolio into a VP and put these theories to the test.  My back testing shows that using 3x LETF's that switch between gold and stocks based on the gold/dow ratio and real interest rates would have an average annual return of 60%, a CARG of 40%, and a standard deviation of 90% (back testing started in 1977).  A little crazy, but just got to ride the bull market and try not to time the short to medium term moves.  Although this may be easier said than done.
User avatar
Gosso
Executive Member
Executive Member
Posts: 1052
Joined: Fri Jan 06, 2012 8:22 am
Location: Canada

Re: A Gold Price Model

Post by Gosso »

Clive wrote: Gosso, I wonder how a simple stochastic based allocation might work compared to switching fully between one or the other (stocks or gold).

Maybe just the Dow/Gold ratio divided by 50 (top) for instance.

Dow/Gold at 7 then 7/50 = 0.14 (14%) gold, which implies 86% stocks.

Dow/Gold at 40 then 40/50 = 0.8 (80%) gold (20% stock).
Hmmm, that's interesting.  Although wouldn't it make more sense to use a logarithmic scale?

I figured I would unwind my position once the indicators began to show signs of the bull market ending (ie dow/gold below ~2.0, and real interest rates starting to move above +2%).  I'd have to make a judgement call on how the indicators are moving and then decide.  Also it would be important to listen to the Fed to determine if they are in the 'interest rate hiking mood'.  Also, if there was a parabolic move while the indicators were weak, then this would be a good time to sell as well.

It might even make sense to switch to cash when the indicators are weak, and then wait for the new bull market to find its legs.
User avatar
Gosso
Executive Member
Executive Member
Posts: 1052
Joined: Fri Jan 06, 2012 8:22 am
Location: Canada

Re: A Gold Price Model

Post by Gosso »

Clive, you could be right that real rates are a lagging indicator.  But I'm fine with that, since I'm looking at decades rather than months.

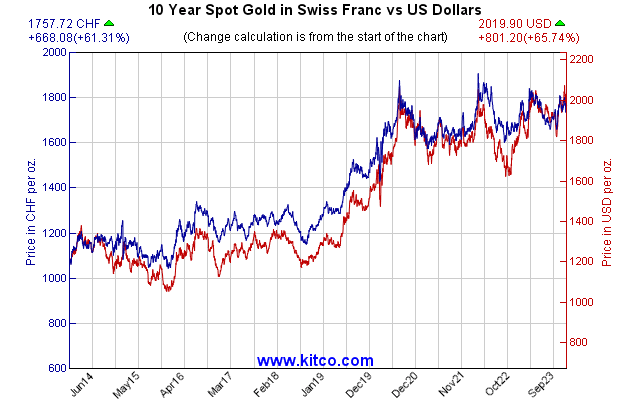
I'm not sure what to make of the currency graphs -- are you saying that gold has gone up simply because the USD has gone down?  If you look at gold priced in the Swiss Franc then you can see gold has still increased, although not as much:

Image

Same can be said for the Loonie:

Image

Also, I'm not sure about using money supply, since money supply is always increasing to accommodate a growing economy/population.  Here's a look at M2:

Image

It could be possible that M2 is a leading indicator, but it appears too choppy to have any predictive qualities.  Maybe a 2 or 3 year trailing average would help?
Post Reply