Dow/Gold Ratio
Moderator: Global Moderator
-
Clive


Re: Dow/Gold Ratio
Gold is in a secular bull market and secular bull markets normally end with some kind of blow off top.
I'm not a huge gold fan, but I would be very surprised if it didn't top $2,000 at some point in the next year or two. I have no idea where any eventual blow off top might take it.
Stocks, OTOH, are in a secular bear market and I would be surprised if stocks did more than trade in a range for probably the next 5-10 years. As we know, however, the strongest equity rallies are normally in secular bear markets (e.g., March 2009 through April 2010) so there are likely to be some nice gains to harvest in equities before another secular bull begins (whenever that may be).
That's my prediction.
Q: “Do you have funny shaped balloons?”
A: “Not unless round is funny.”
A: “Not unless round is funny.”

Re: Dow/Gold Ratio
Ah yes, the Dow/Gold ratio...my favorite subject at the present. Put simply, I'm a big believer in it and invest accordingly. What it tells us is that there are generational periods (15-20 years) where financial and hard assets go in and out of favor. What I particularly like about this ratio is that the turning points are so far out they tend to drown the market noise. If you are familiar with the 17-18 year cycle, you notice tendencies for investors to act in classic herd behavior. These cycles don't act with precision--17.5 years is an average, but economic changes around these time periods are striking.
An important note about the Dow/Gold ratio is the relationship between asset values and currency values. During the 30s, the U.S. was on a gold standard, so the Dow had nowhere to go but down to meet gold at a 2:1 ratio. In 1971, the U.S. defaulted on Bretton Woods, allowing it to devalue the USD throughout the 70s and into the early 80s. This kept asset values high, so instead of the Dow crashing from 1966-1969, it "crashed" very slowly relative to the value of gold. In September of 1979, the Dow/Gold ratio was again 2:1, but monetary velocity was accelerating which resulted in a concomitant rise in the gold price (suggesting further devaluation). The Dow/Gold ratio eventually hit a low of 1:1 on January 21st, 1980 at intraday prices of 850 each. In an inflationary mania, the blowoff top MT mentioned is typical. In a deflationary panic, the blowoff top is inverted as a crash.
Another interesting tidbit is that both in 1932 and 1979/80, the gold price matched the value of all base money + revolving credit outstanding. What this suggests is that during the extreme bearish moments (in paper assets), investors rush down Exter's liquidity pyramid wanting the rock of all assets: gold. Once paper assets hit rock bottom and the system is purged sufficiently, they begin their new ascent and the cycle begins again. The target for this cycle change is roughly 2017, give or take a year.
I do believe we'll see a 2:1 Dow/Gold ratio again at a minimum. It seems to be the point at which gold's "fear" value is highest in combination with monetary aggregate equilibrium. Not to say it won't go to 1 or below in a turbulent environment. But there seems to be a natural "reset" at the 2:1 level. What does that mean in nominal terms? I don't have a crystal ball, nor does anyone else. But I do think if the powers that be would allow the liquidation, we would see a fair value in the Dow around 4000-5000, which would suggest a gold price north of $2500. However, I think the highest probability goes to a stagflationary outcome somewhere in the Dow 7000-8000 range and gold north of $4000. If we get a sovereign debt crisis in the U.S., I think we'll see prices near $10K.
As you can see, even at $1100 gold in 2009, assets held in gold are but a tiny fraction of what they were at previous peaks in history. We have a long way to go if history is to "rhyme."
Here's a chart of the 17-18 year cycle:
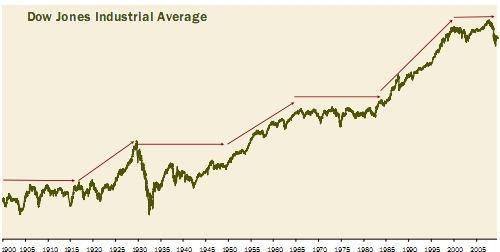
Notice peaks in 1929, 1966, 2000. Notice troughs in 1913, 1947, 1982.
Here is an inflation-adjusted chart of the DJI:

For what it's worth, I think Steven J. William's analysis is excellent. Nothing has to happen, and anything can happen, as Harry Browne once said. As always, stay diversified.
An important note about the Dow/Gold ratio is the relationship between asset values and currency values. During the 30s, the U.S. was on a gold standard, so the Dow had nowhere to go but down to meet gold at a 2:1 ratio. In 1971, the U.S. defaulted on Bretton Woods, allowing it to devalue the USD throughout the 70s and into the early 80s. This kept asset values high, so instead of the Dow crashing from 1966-1969, it "crashed" very slowly relative to the value of gold. In September of 1979, the Dow/Gold ratio was again 2:1, but monetary velocity was accelerating which resulted in a concomitant rise in the gold price (suggesting further devaluation). The Dow/Gold ratio eventually hit a low of 1:1 on January 21st, 1980 at intraday prices of 850 each. In an inflationary mania, the blowoff top MT mentioned is typical. In a deflationary panic, the blowoff top is inverted as a crash.
Another interesting tidbit is that both in 1932 and 1979/80, the gold price matched the value of all base money + revolving credit outstanding. What this suggests is that during the extreme bearish moments (in paper assets), investors rush down Exter's liquidity pyramid wanting the rock of all assets: gold. Once paper assets hit rock bottom and the system is purged sufficiently, they begin their new ascent and the cycle begins again. The target for this cycle change is roughly 2017, give or take a year.
I do believe we'll see a 2:1 Dow/Gold ratio again at a minimum. It seems to be the point at which gold's "fear" value is highest in combination with monetary aggregate equilibrium. Not to say it won't go to 1 or below in a turbulent environment. But there seems to be a natural "reset" at the 2:1 level. What does that mean in nominal terms? I don't have a crystal ball, nor does anyone else. But I do think if the powers that be would allow the liquidation, we would see a fair value in the Dow around 4000-5000, which would suggest a gold price north of $2500. However, I think the highest probability goes to a stagflationary outcome somewhere in the Dow 7000-8000 range and gold north of $4000. If we get a sovereign debt crisis in the U.S., I think we'll see prices near $10K.
As you can see, even at $1100 gold in 2009, assets held in gold are but a tiny fraction of what they were at previous peaks in history. We have a long way to go if history is to "rhyme."
Here's a chart of the 17-18 year cycle:
Notice peaks in 1929, 1966, 2000. Notice troughs in 1913, 1947, 1982.
Here is an inflation-adjusted chart of the DJI:
For what it's worth, I think Steven J. William's analysis is excellent. Nothing has to happen, and anything can happen, as Harry Browne once said. As always, stay diversified.